The first half of 2019 has already passed and FraudScore is ready to share some data about the first six months of the year. In this report FraudScore shares ad fraud statistics in terms of GEO regions, fraud categories distribution, the differences between mobile and web traffic etc.
Disclaimer: FraudScore shares traffic data that was only processed by our platform. The traffic sources and fraud statistics referred to in this article were audited by FraudScore. If you have questions — feel free to contact our team for further explanations and the system presentation to get acquainted with our technologies and tool.
Key Takeaways:
- According to the international marketing forecasts in 2019 online advertising is about to take 47% of all global digital ad budgets. The number will rise up to 51% by 2023.
- The World Federation of Advertisers has published a research stating that by 2025 the marketers will lose 38 billion pounds to fraudsters.
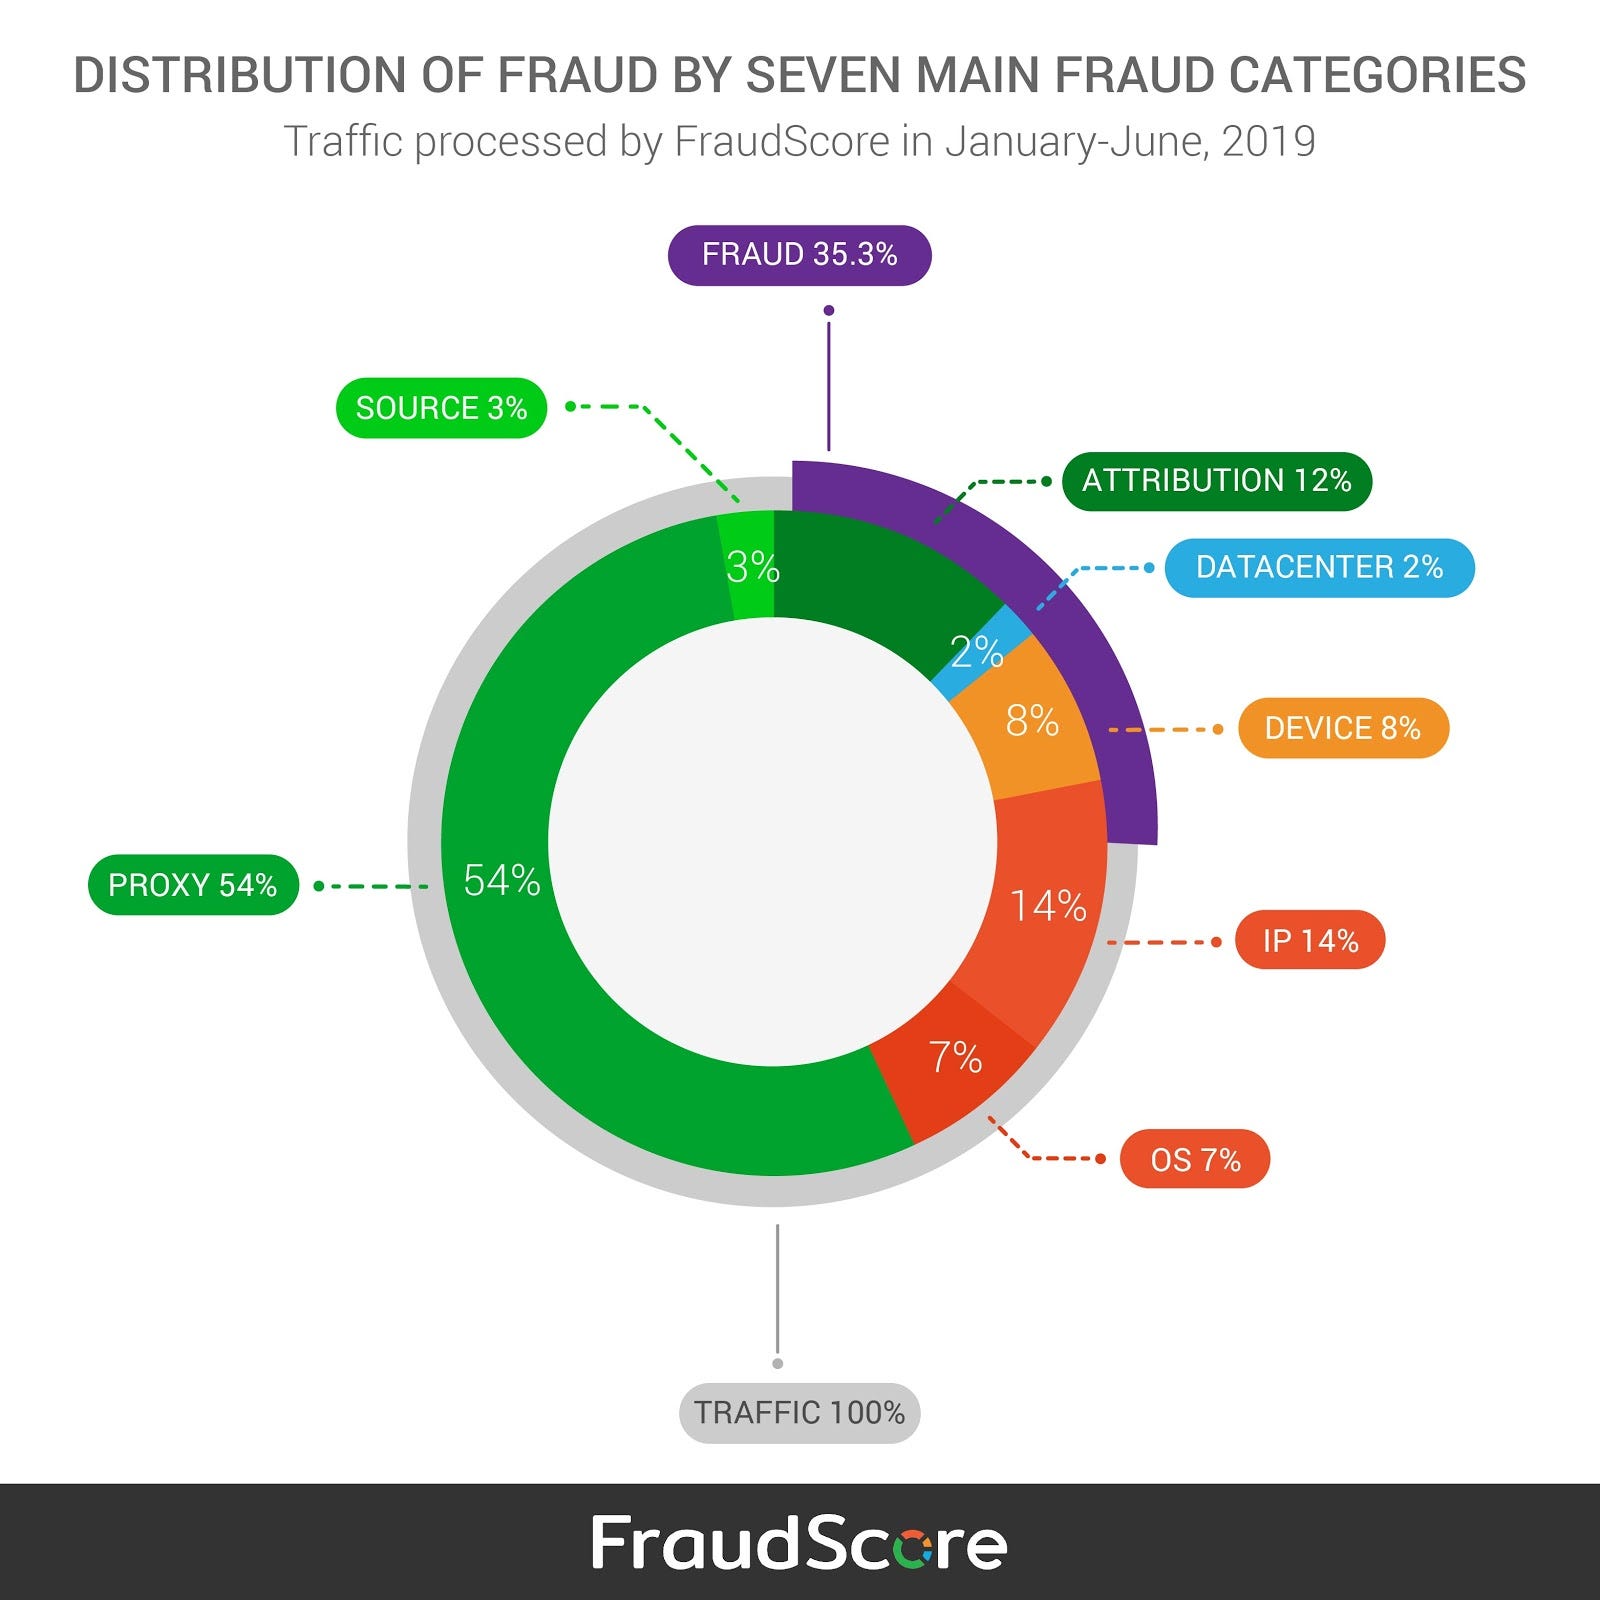
- 35.3% of traffic was detected as fraudulent (according to FraudScore statistics).
- Botnets and adware are on the rise.
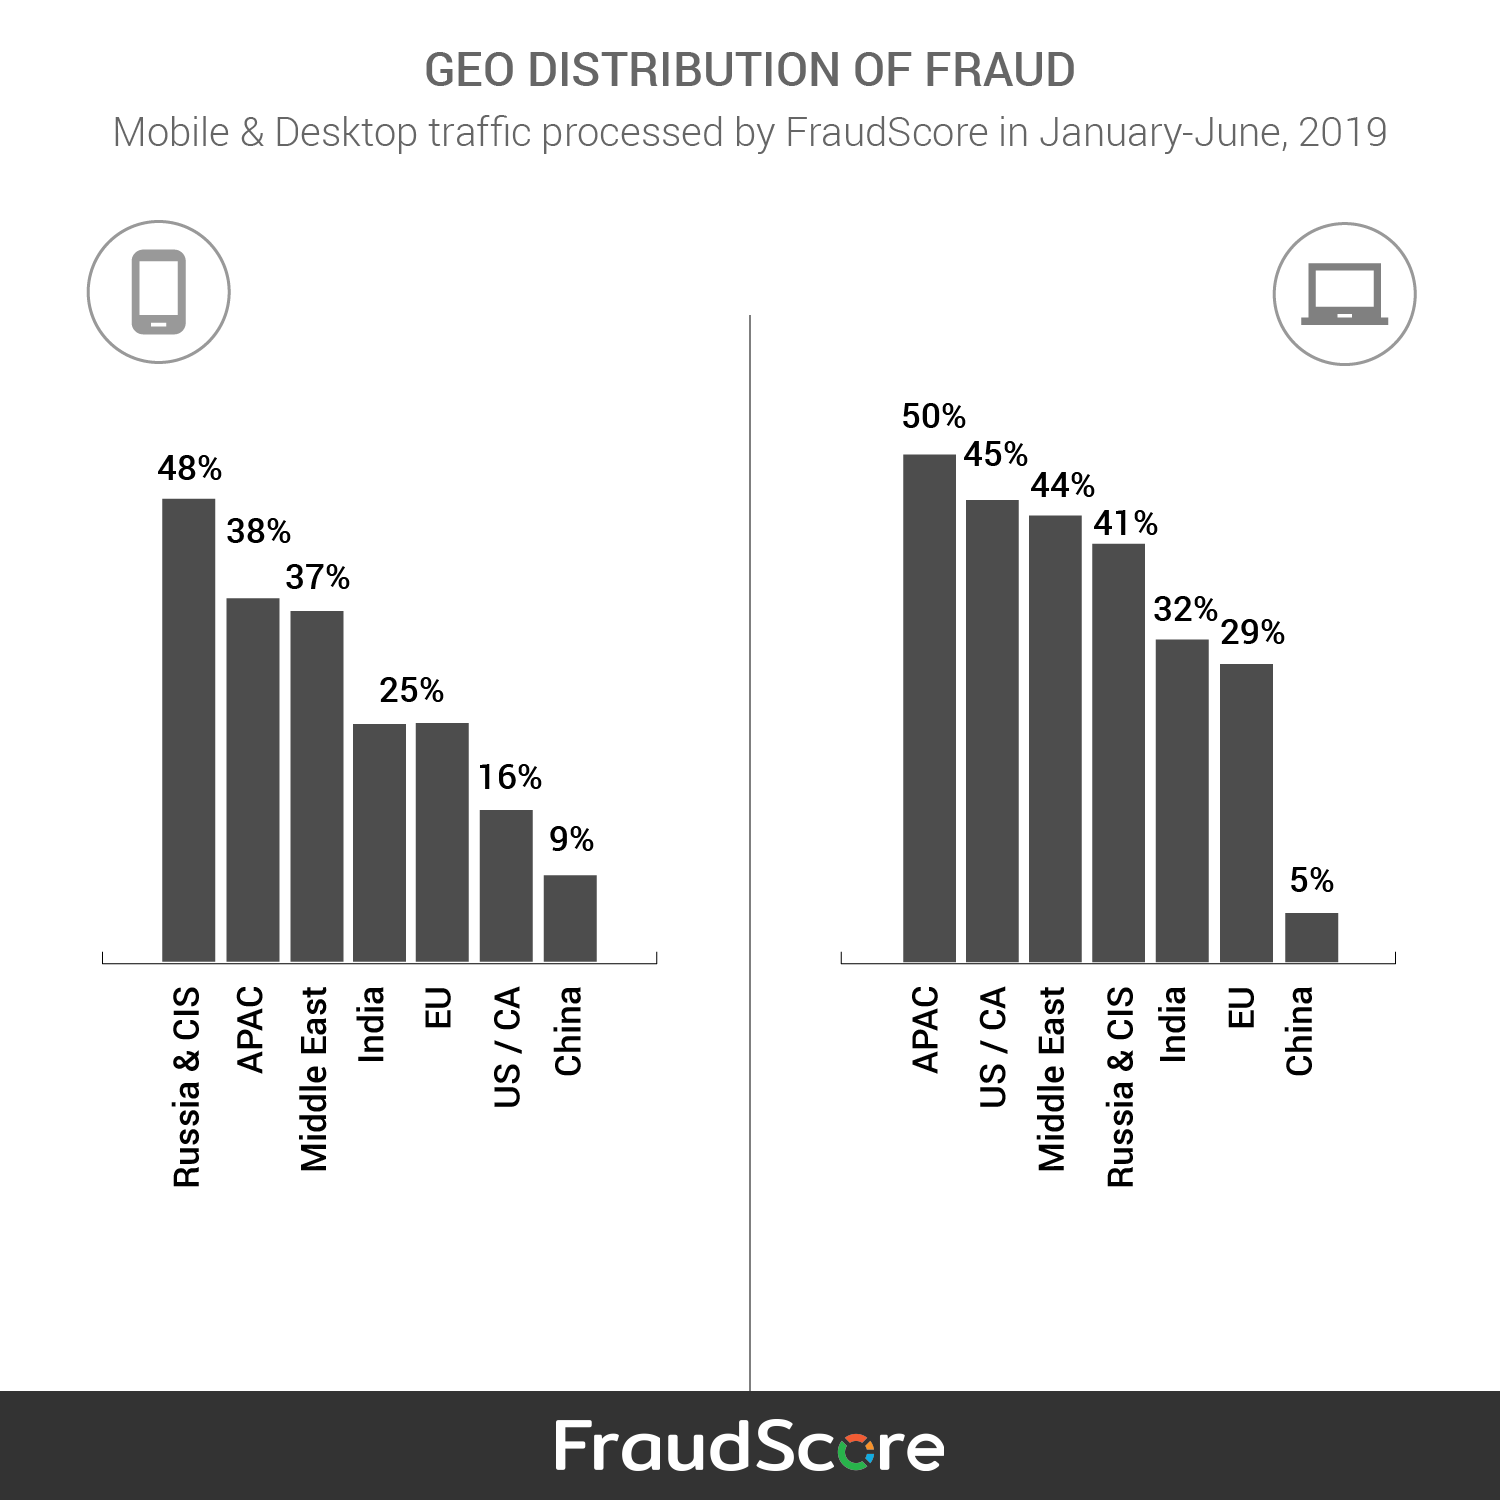
- Russia, CIS and APAC countries are the top three GEOs in mobile fraud.
- APAC, USA and Middle East are the top three GEOs in web fraud.
General numbers
FraudScore statistics have shown that 35.3% of all processed traffic was fraudulent. FraudScore approach evaluates conversions based on various metrics and assigns conversions with “fraud score” — an evaluation of the possibility of fraud. So 35.3% of all processed traffic has fallen into the “High” category meaning that those conversions (traffic) are definitely fraudulent.
When it comes to fraud categories, FraudScore data shows that:
1. PROXY is the most detected metric:
- Traffic that is routed through an intermediary proxy device or network where the ad is rendered in a user’s device where there is a real human user.
- IPs that are associated with known Botnets and Adware.
- Users are actively hiding their identity or masking conversions from an unwanted GEO.
2. IP comes next. All anomalies connected with IP-fraud are in this category. For instance, multiple conversions from the same IP or multiple conversions from the same IP subnet.
3. Attribution fraud comes in third. Attribution fraud is still on the rise as this claim is also supported by various global reports:
- Clickspamming — App installs previously attributed to clicked ads were discovered to be user-generated app installs randomly claimed by ad networks by spamming the fingerprinting algorithms.
- Cookie stuffing — the process by which a client is provided with cookies from other domains as if the user had visited those other domains taking ad tags from a publisher’s site and putting them on to another site without the publisher’s knowledge.
- Click injection(Android only) — Android is uniquely vulnerable to click injection fraud, in which an ad network takes credit for organic app installs.
If you want to learn more about FraudScore fraud categories and division approach — check our Knowledge base.
GEOs
Marketers are well aware that there are some regions around the globe that require a closer look at traffic and sources that process it. FraudScore shares the data for both mobile and web traffic — the ratings show that fraud-leaders are almost the same, but the numbers differ:
Web traffic fraud leader ratings:
- APAC — 50%
- US and Canada — 45%
- Middle East — 44%
Mobile traffic fraud leader ratings:
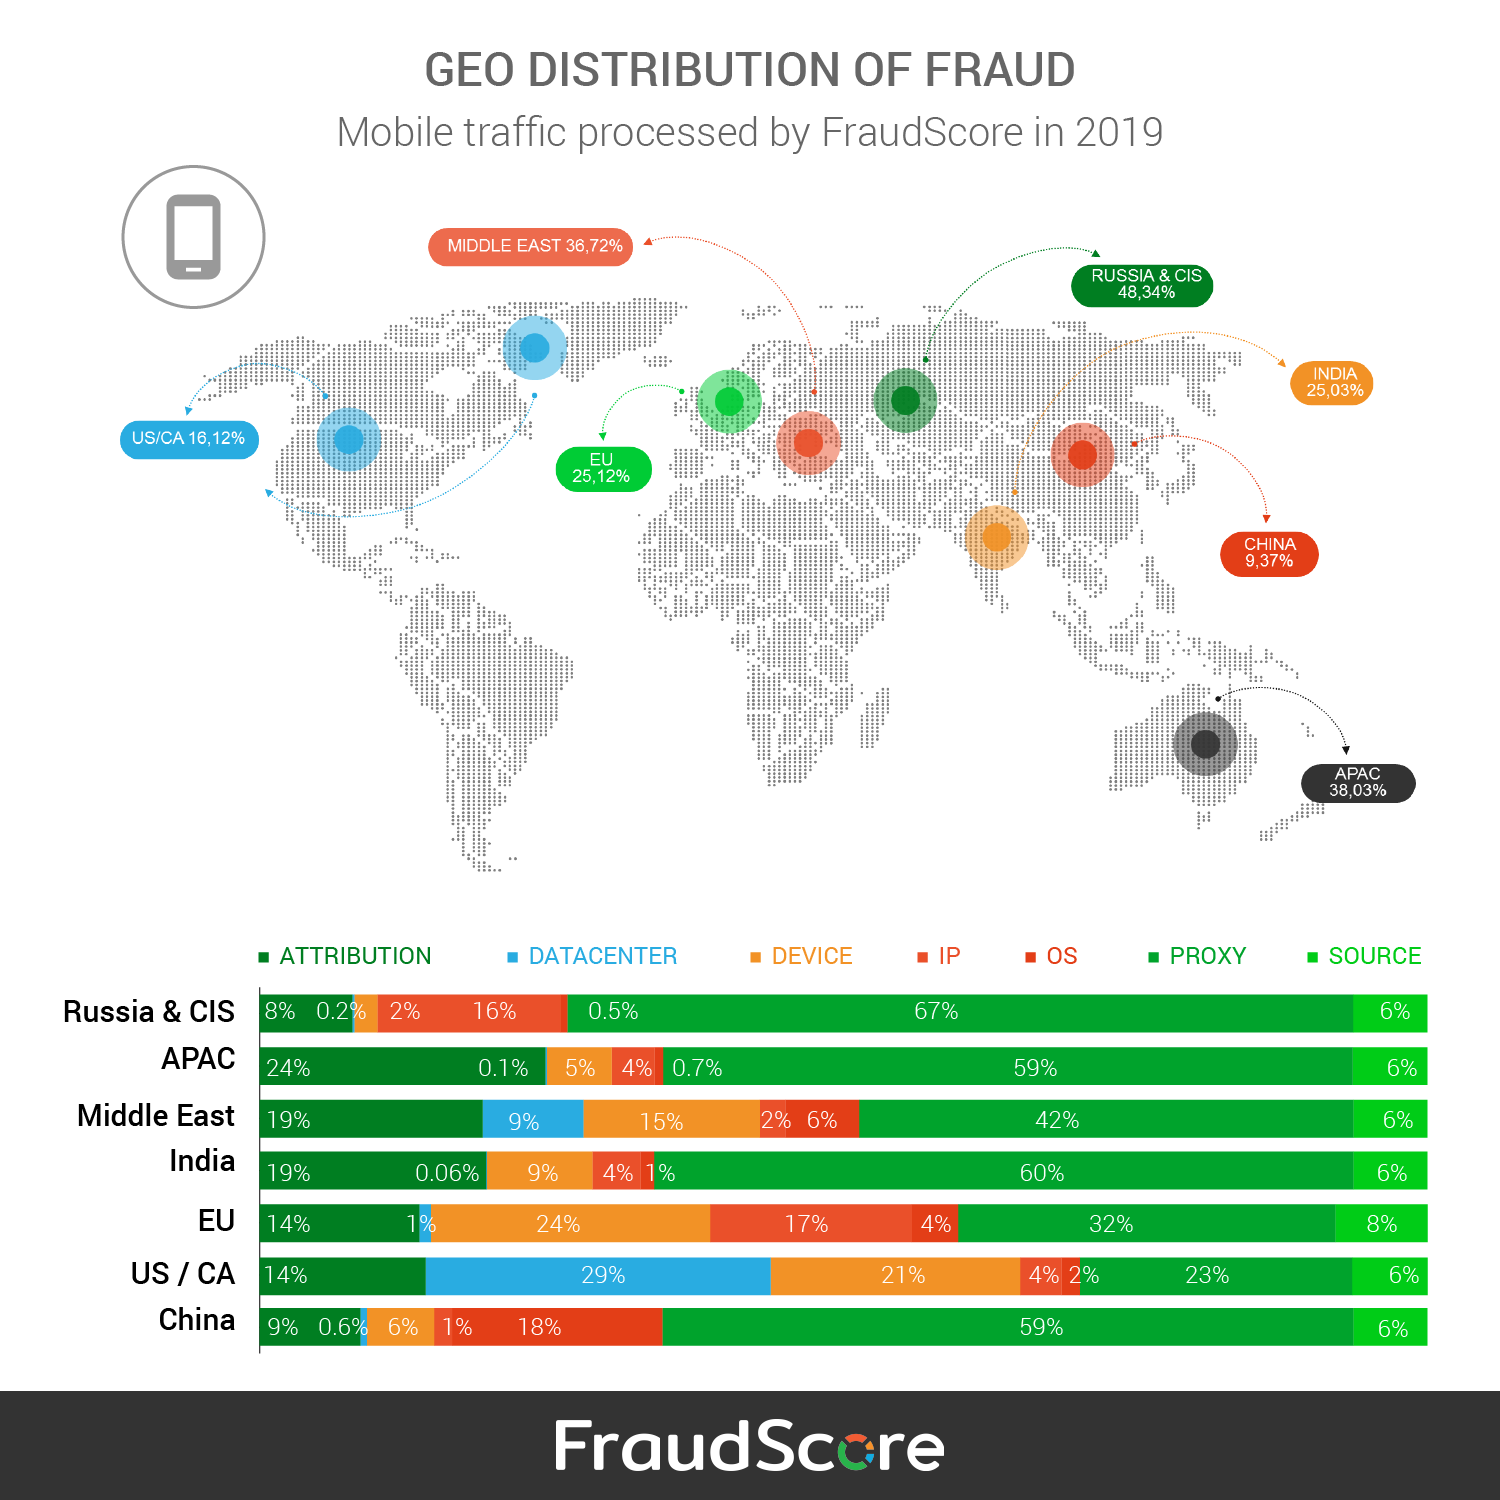
- Russia & CIS — 48%
- APAC — 38%
- Middle East — 37%
Web-traffic
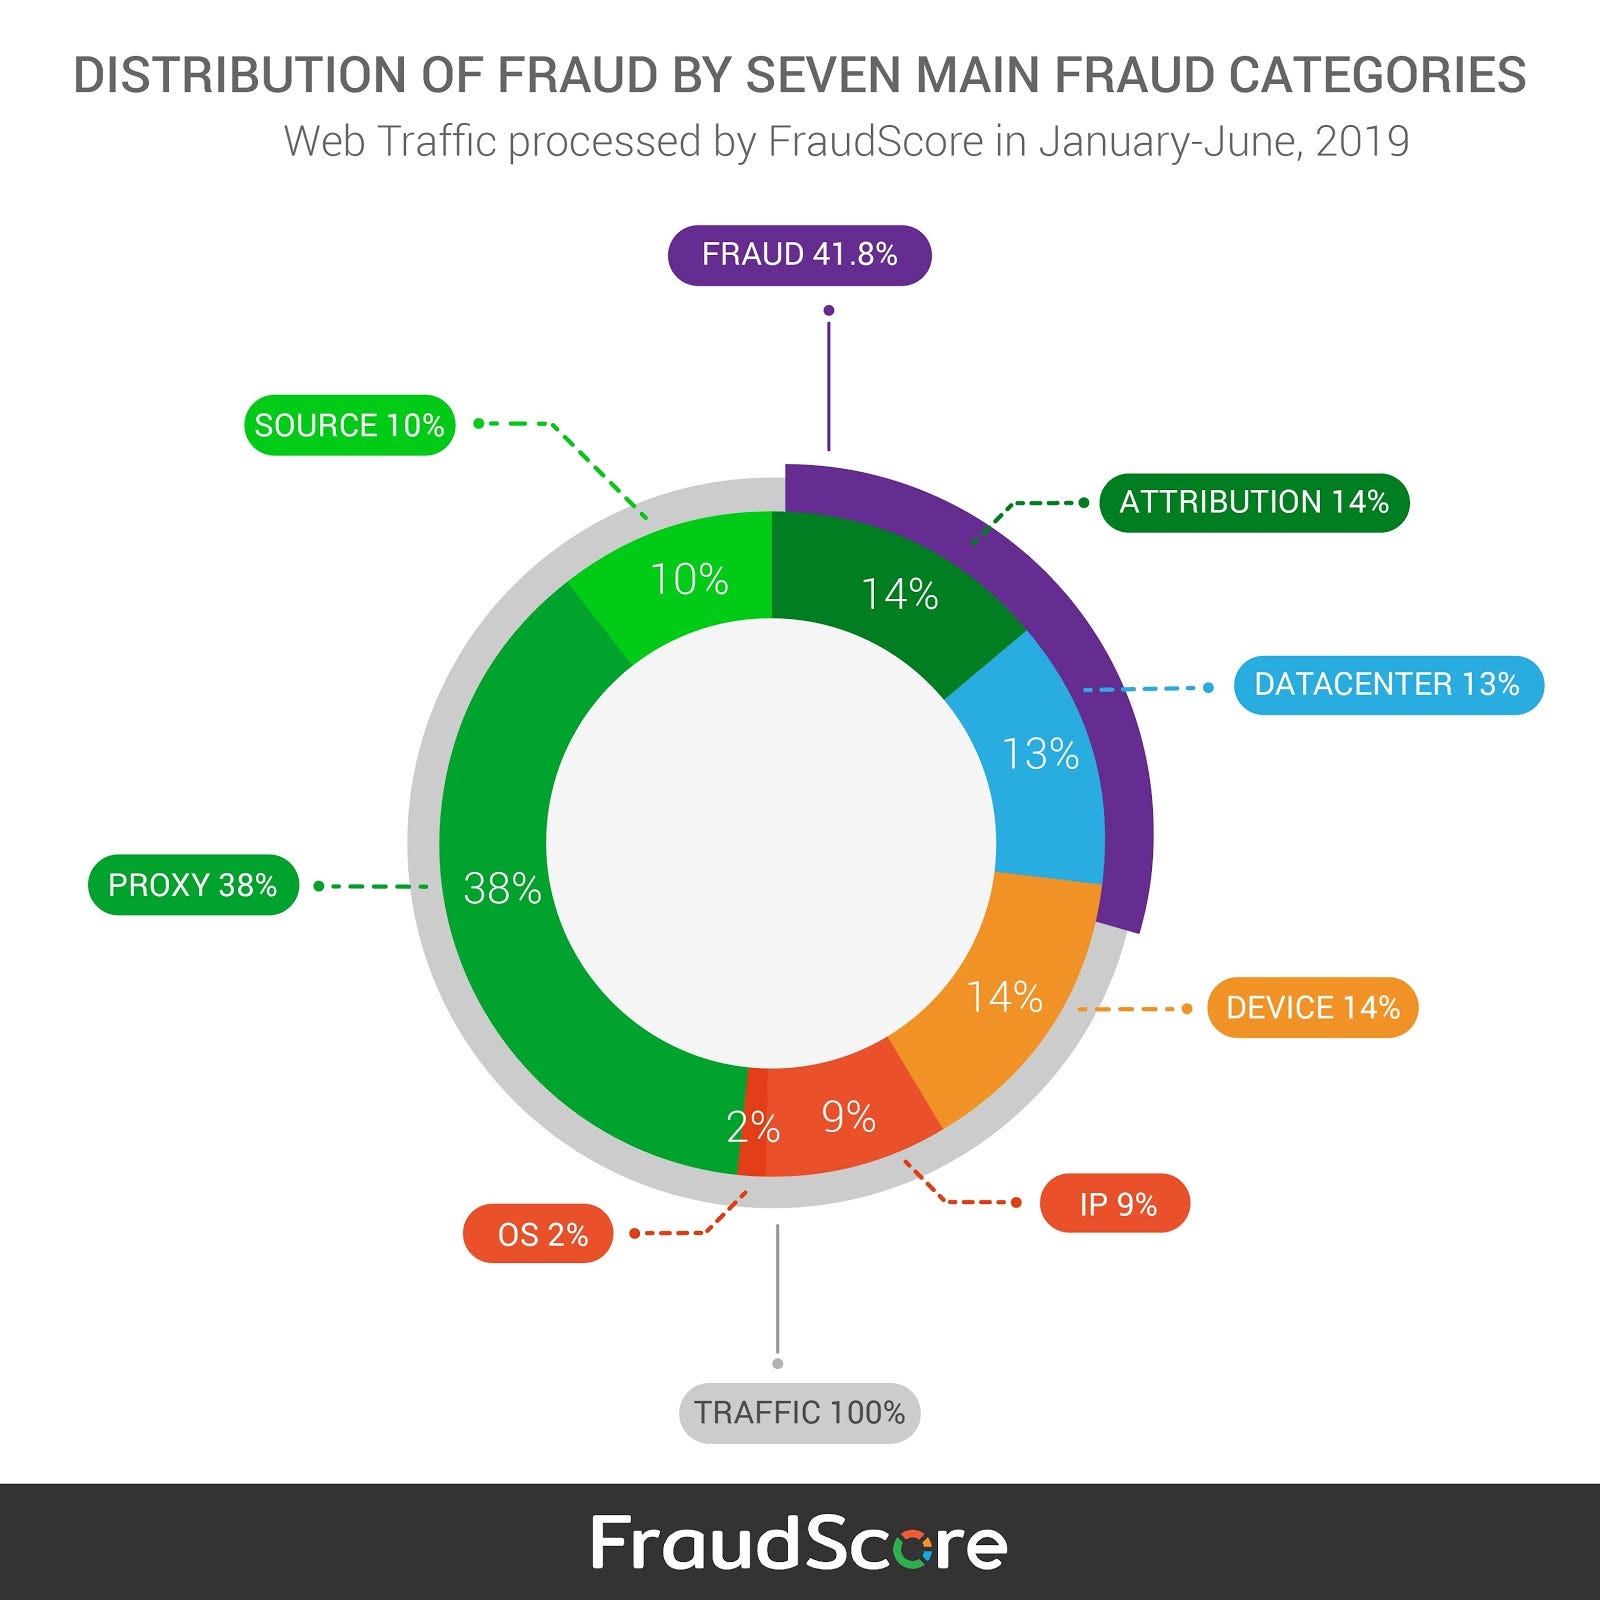
In the first six months of 2019 FraudScore finds that 41.8% of all processed desktop traffic is fraudulent.
Proxy fraud and attribution are the leaders with 38% and 14% respectively.
Device fraud comes next — all anomalies that are connected with user device parameters.
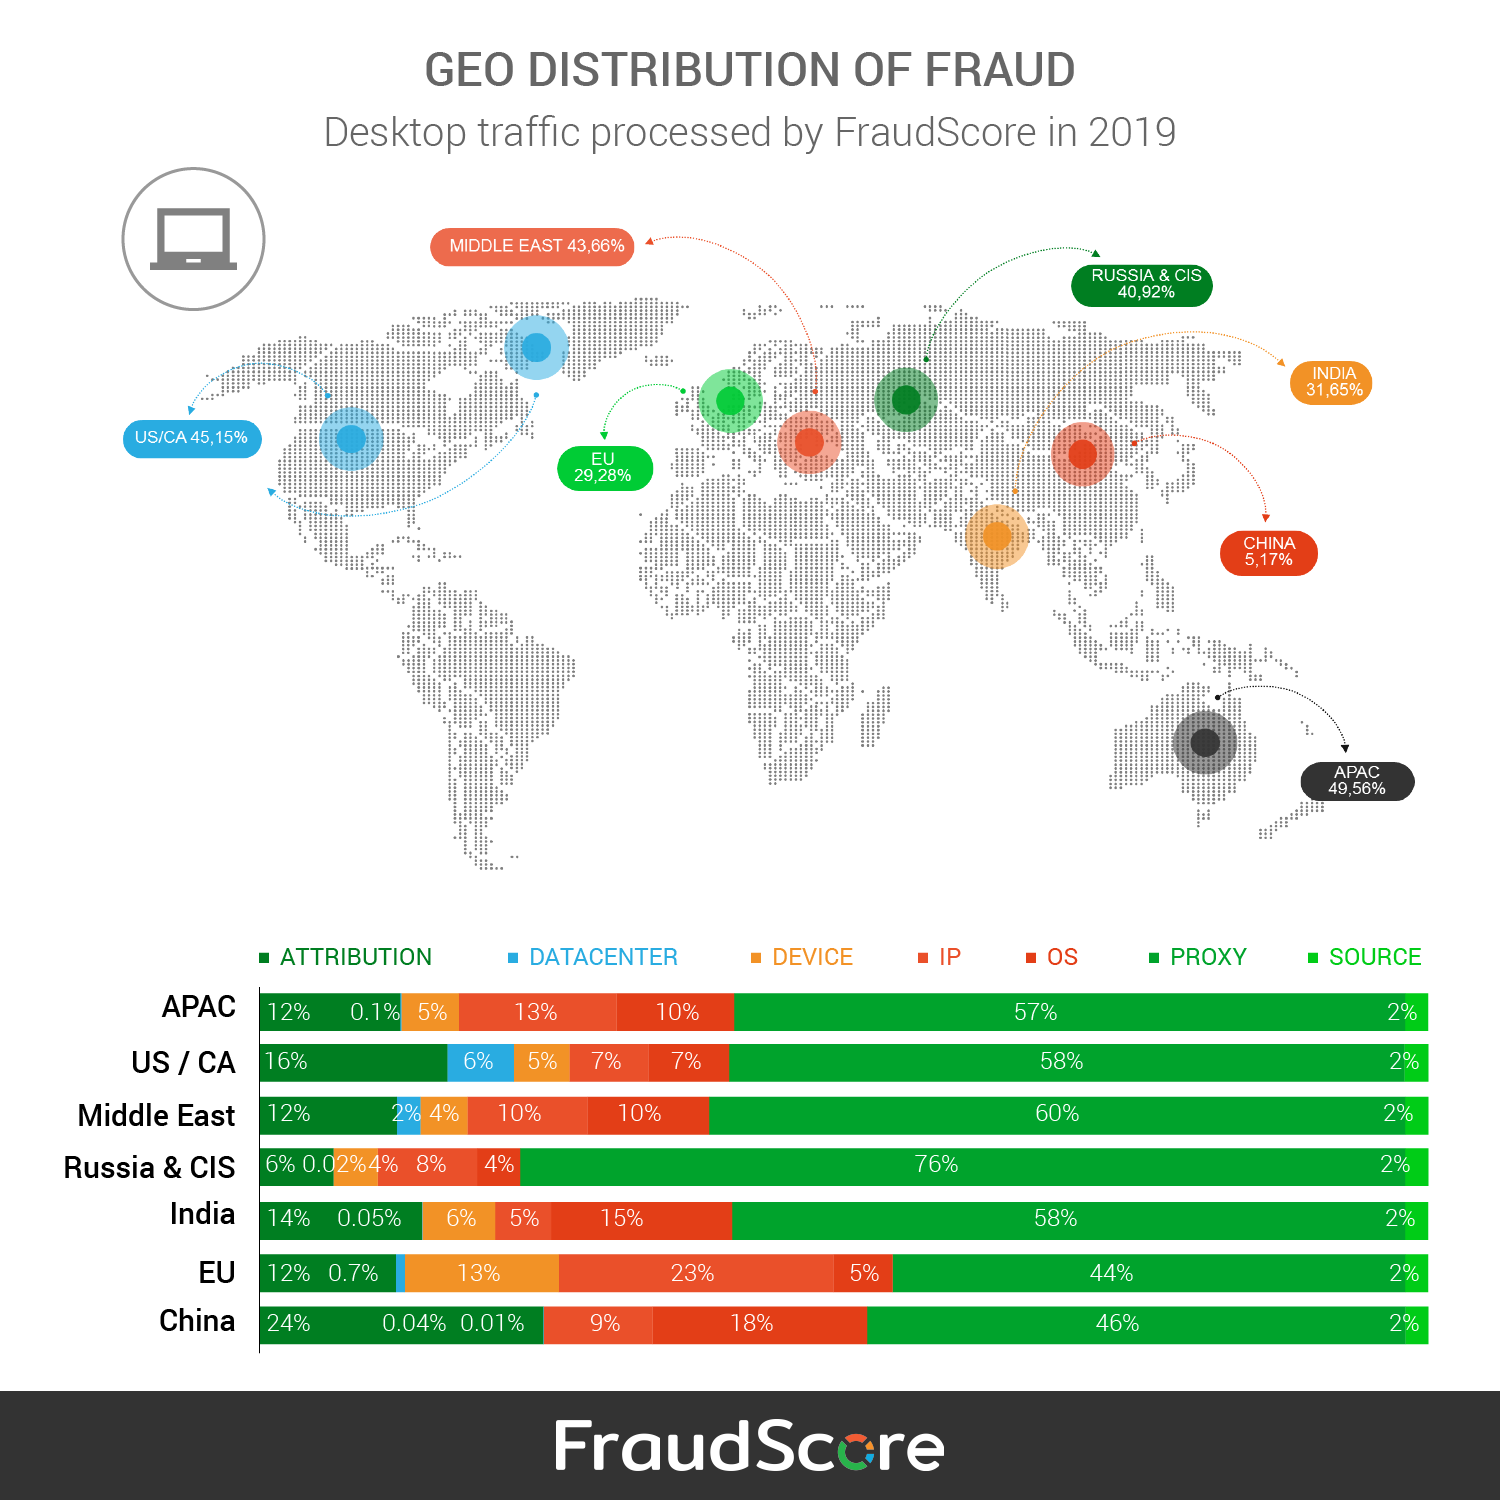
APAC — region with the highest levels of fraud. Proxy and Attribution fraud as the most detected metrics.
USA and Canada tie for second place as the most fraud-prone GEOs with Datacenter, Device and Proxy fraud.
Middle East takes third place in the fraud rating with Proxy, Attribution and Device fraud.
Mobile:
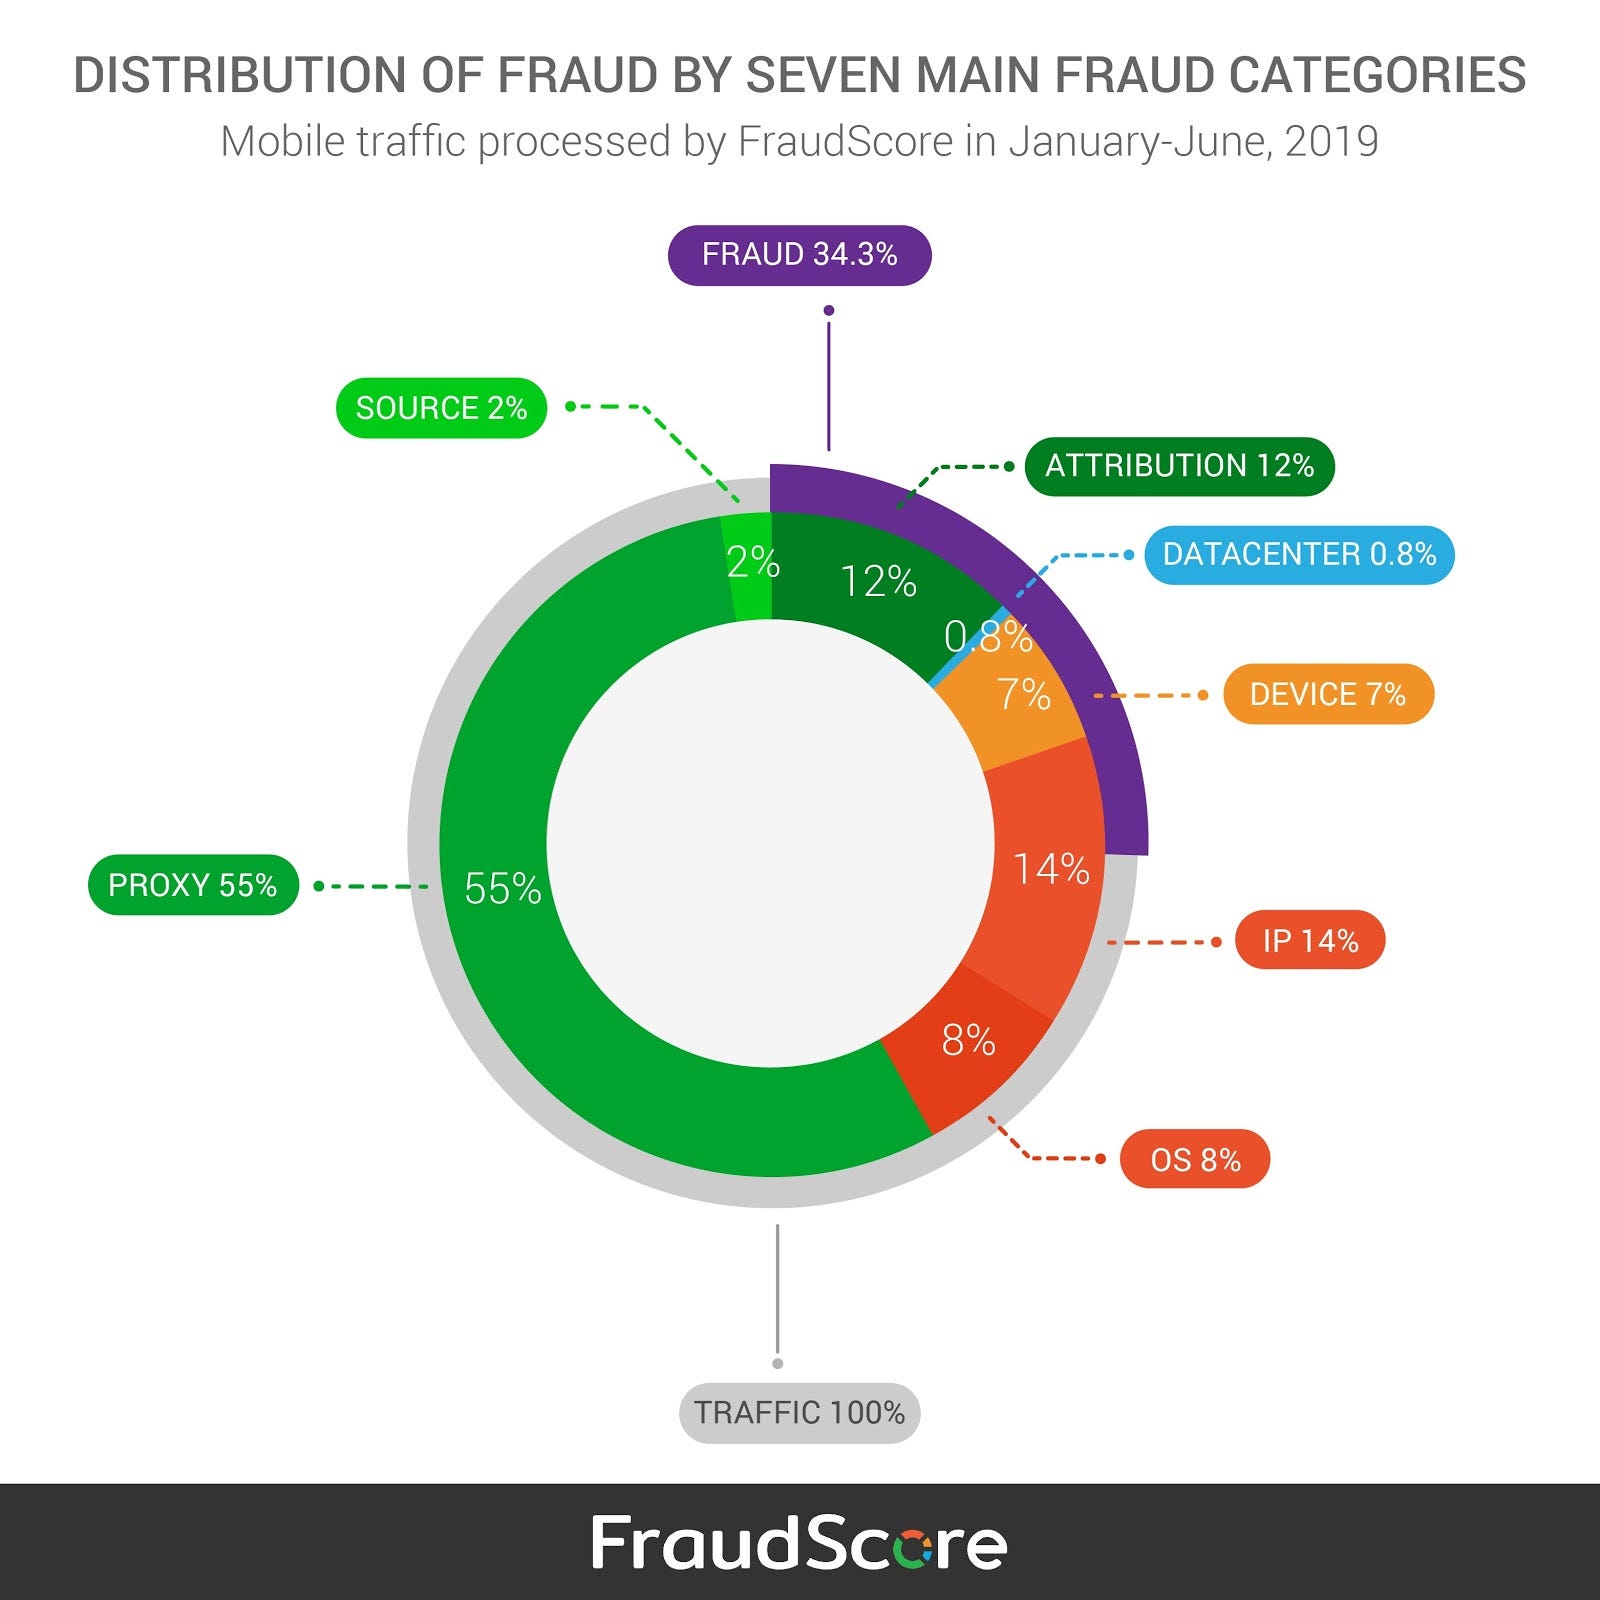
- In the first six months of 2019 FraudScore finds that 34.3% of all processed mobile traffic is fraudulent.
- Proxy fraud and IP are the leaders with 55% and 14%.
- Attribution fraud comes next — various types of attribution fraud, including the most widely known — clickspamming, click injection and cookie stuffing.
- Russia & CIS — regions with the highest levels of fraud with Proxy and IP fraud categories as the most detected.
- APAC comes in second with Proxy, IP and OS fraud categories as the leaders.
- Middle East is in third place with Proxy, Attribution, IPs and Operation System fraud.
- iOS fraud has had a remarkable increase since the end of 2018. iOS traffic has scored 35.42% in fraud.
- Android traffic is 28.16% fraudulent. Both OS are becoming equally fraudulent in terms of ad traffic.
Roman Safonov, FraudScore CPO: It looks like all the previous trends (from the end of 2018) are still rapidly developing — OTT fraud, botnets and malware, attribution. Recently, the attribution have been making its way to leading positions and there are statistics for some GEO regions that show clickspamming as the most damaging fraud type. We’ll see at the end of the year, but for now — fraud is there and the scale is not decreasing.
